DolphinSuite
All raw sequencing data (scRNA-Seq, scATAC-Seq and CAGE-Seq) were processed by pipelines developed within the interactive pipeline manager DolphinNext (Yukselen et. al 2020). The metadata as well as the processed datasets are currently being hosted in DolphinSuite, an end-to-end bioinformatics analysis platform.
DolphinSuite Platforms
UMass Chan Medical School BioCore has developed DolphinSuite, a bioinformatics platform to support the analysis of high throughput data. DolphinSuite tracks samples from sample collection to data processing (sequencing, proteomics, metabolomics) and provides interactive analysis using an intuitive web interface. DolphinSuite is built to ensure secure access to the processed data using 3rd party applications for tailor-made analysis and data sharing.
DolphinSuite is comprised of three major components that supports distinct aspects of high throughput data analysis.
Dnext: a distributed data processing platform for high throughput genomics |
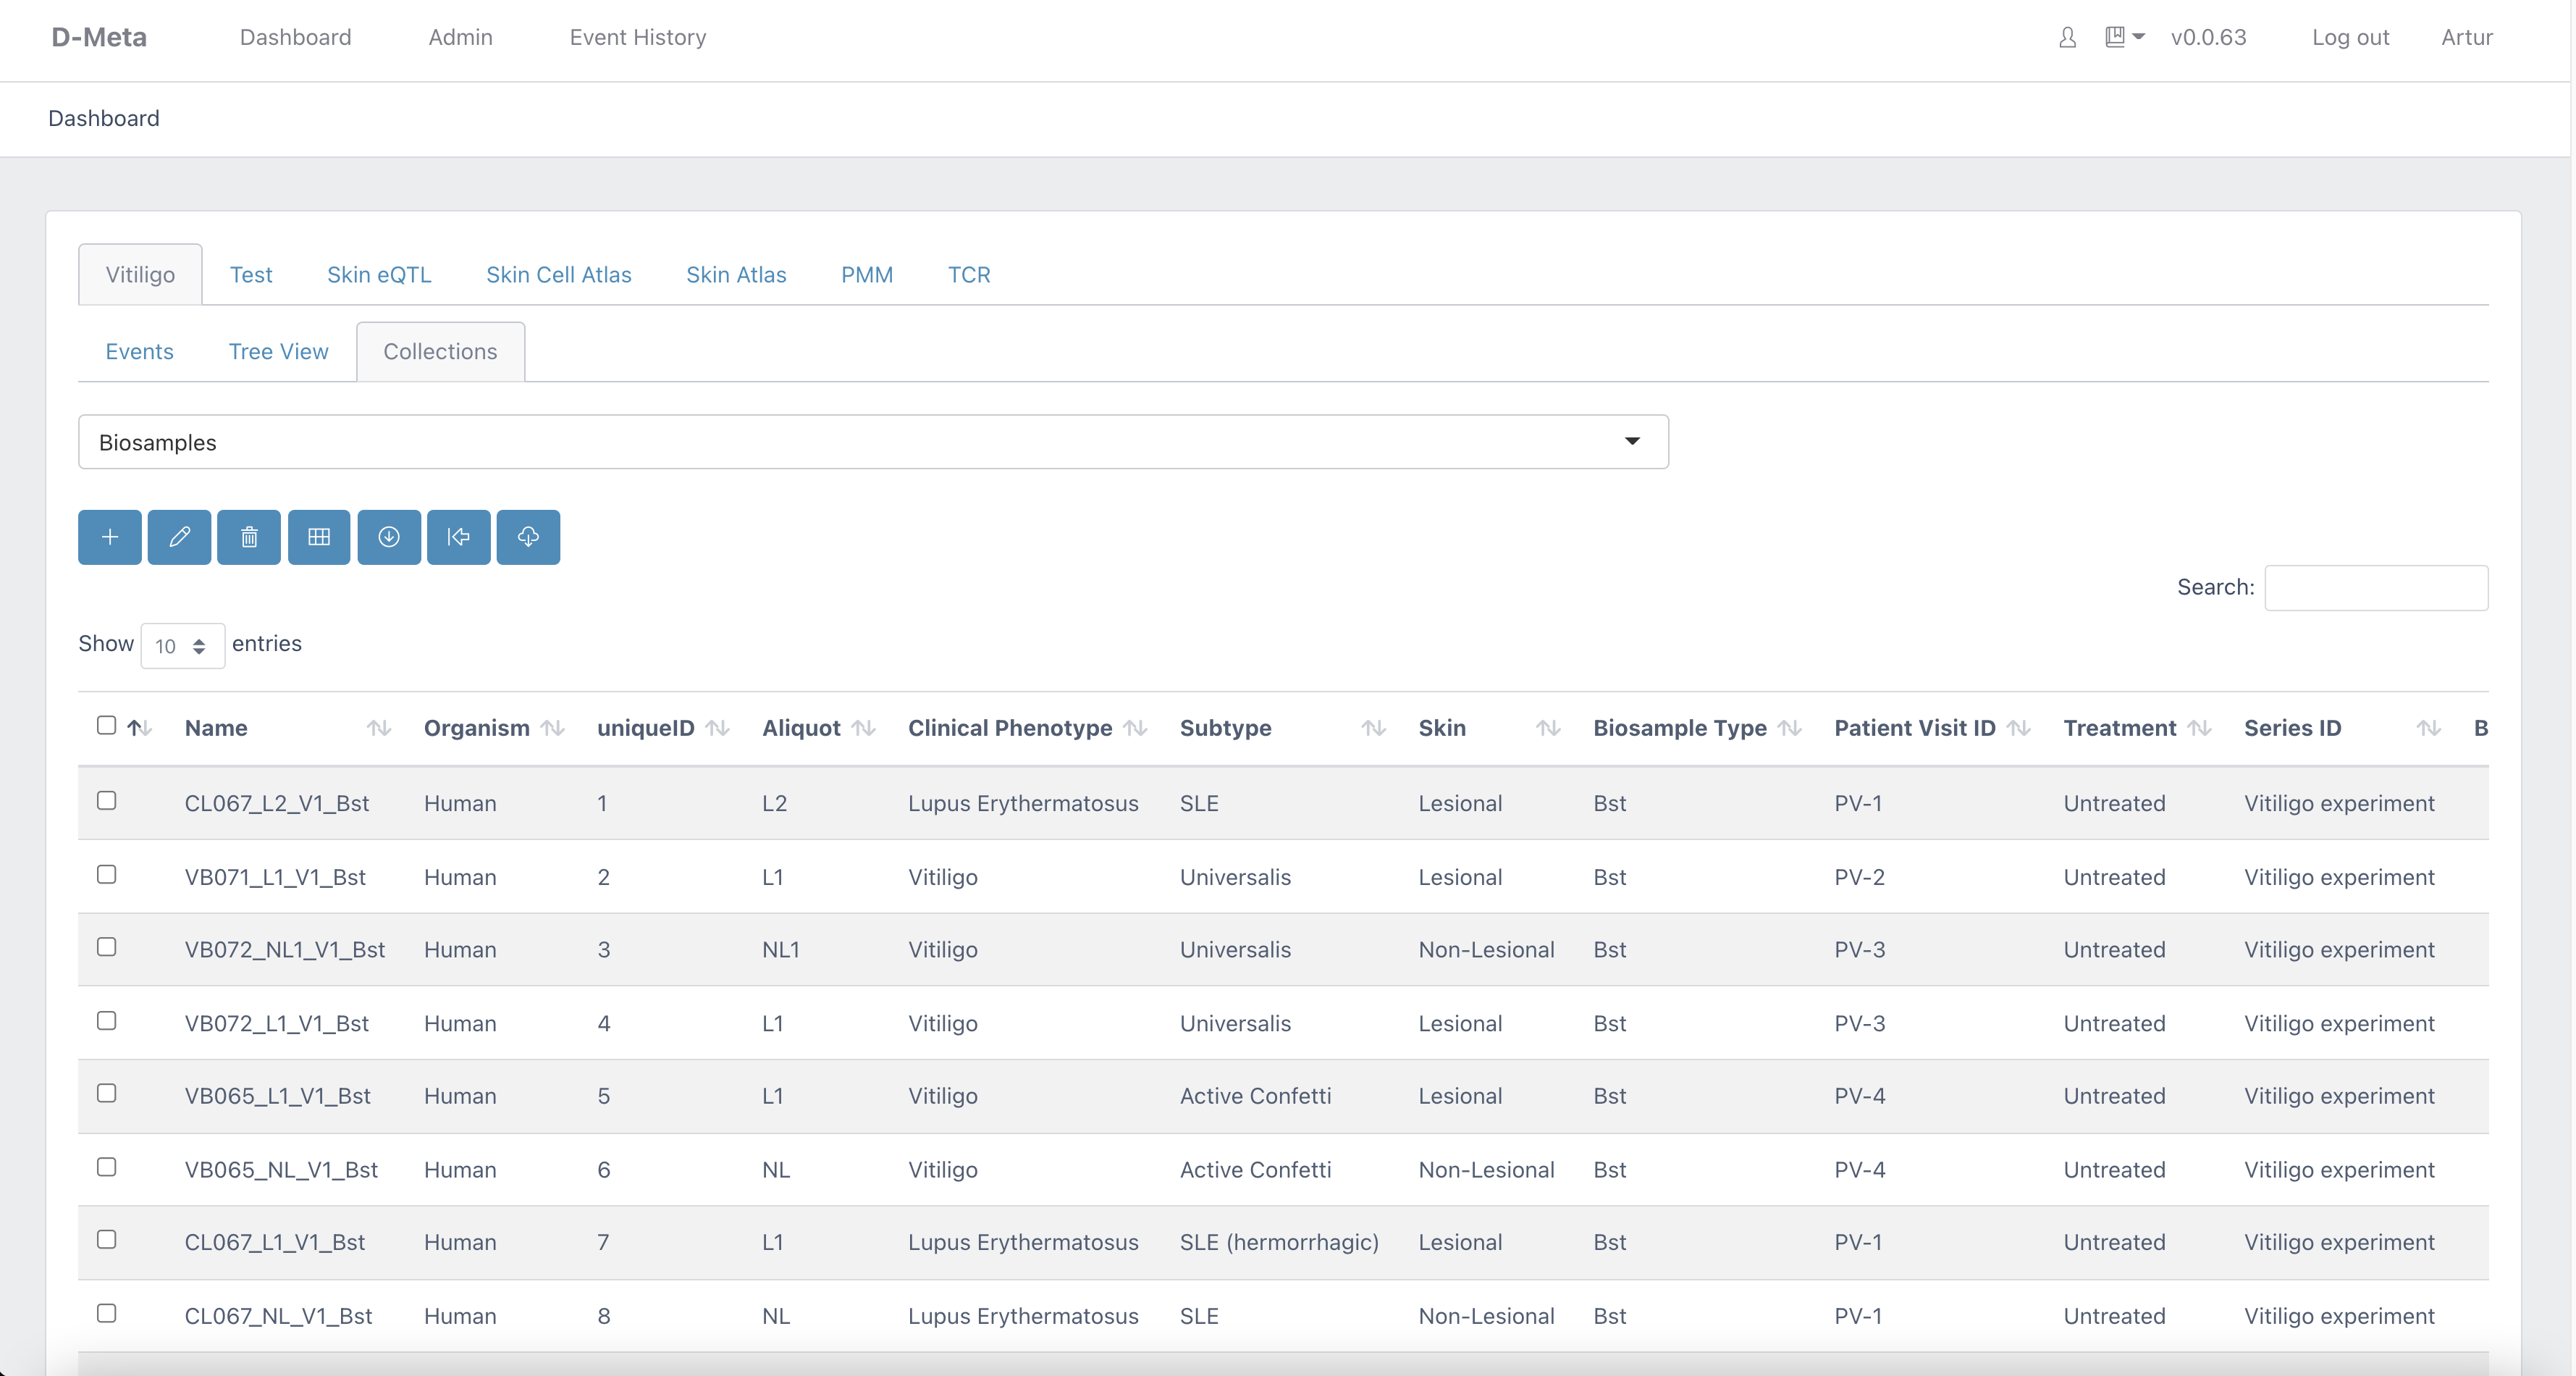
Dmeta: automated data processing and management using ontology-based metadata tracking system |
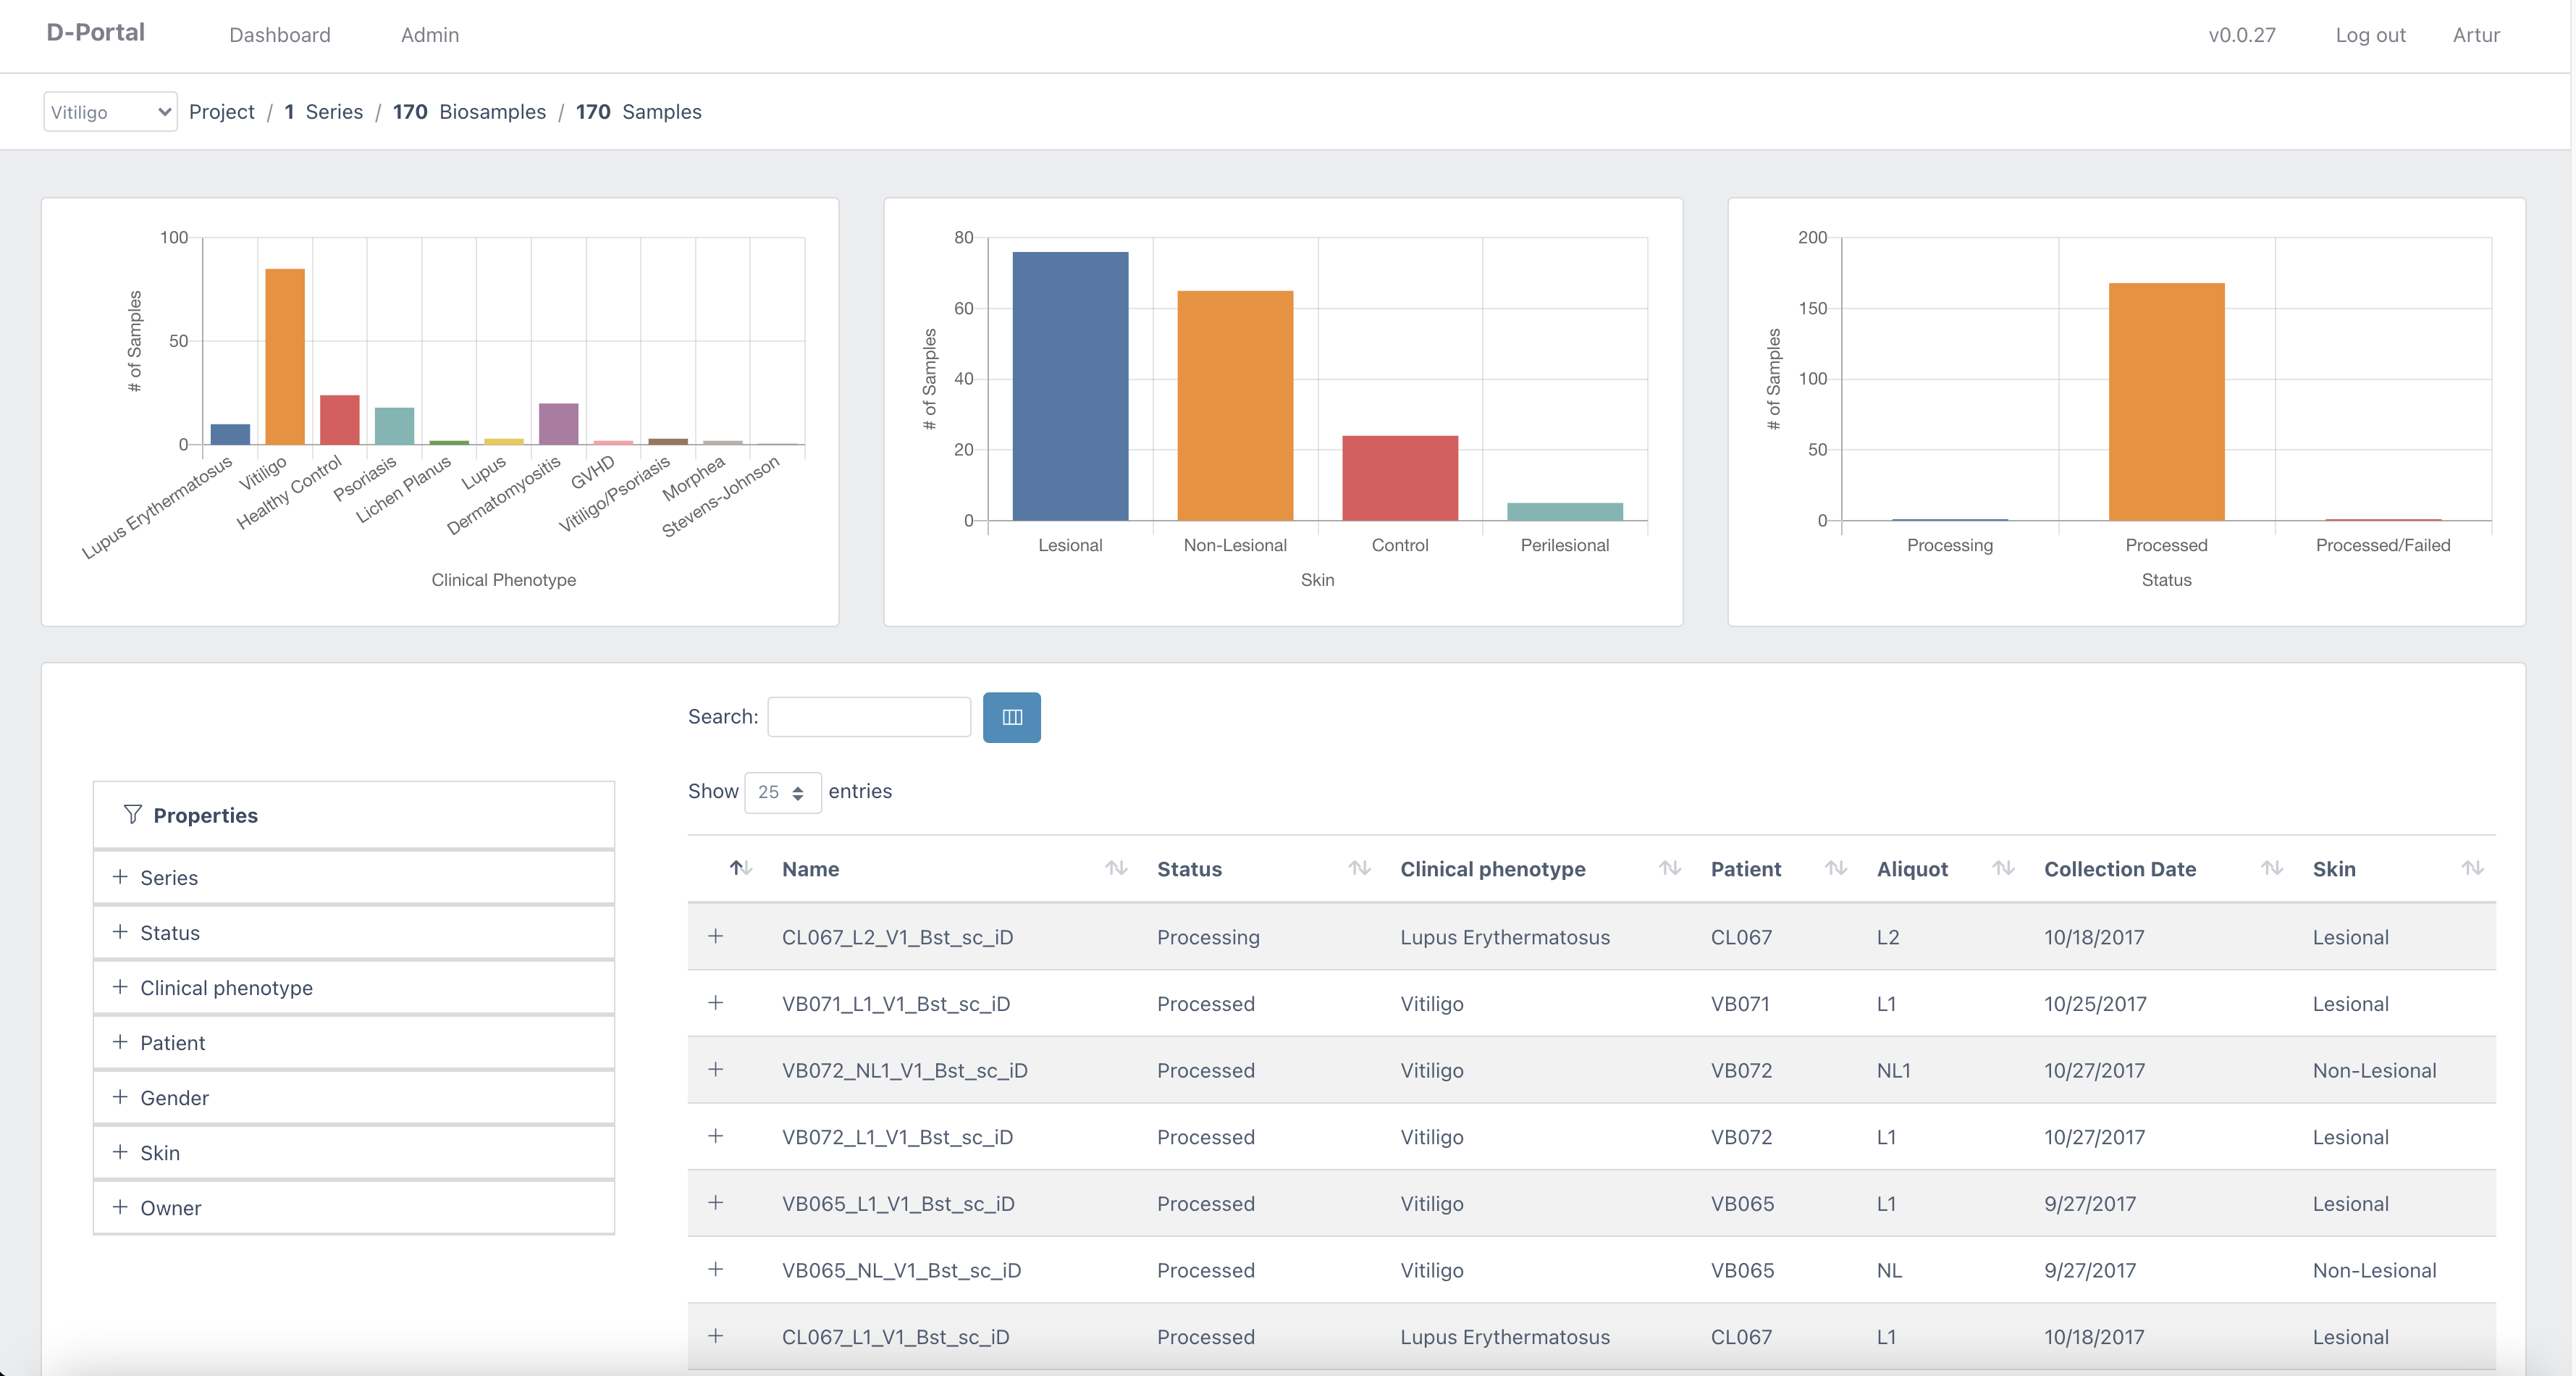
Dportal: a user-friendly and interactive data browser for filtering and querying |
Preprocessing Pipelines
DolphinNext is a revolutionary pipeline management system that allows users to interactively customize data pre-processing workflows and ensures reproducibility of analysis results. Below, we give a summary of three pipelines that are used to process scRNA-Seq, scATAC-Seq and CAGE-Seq reads incorporated in this project.
|
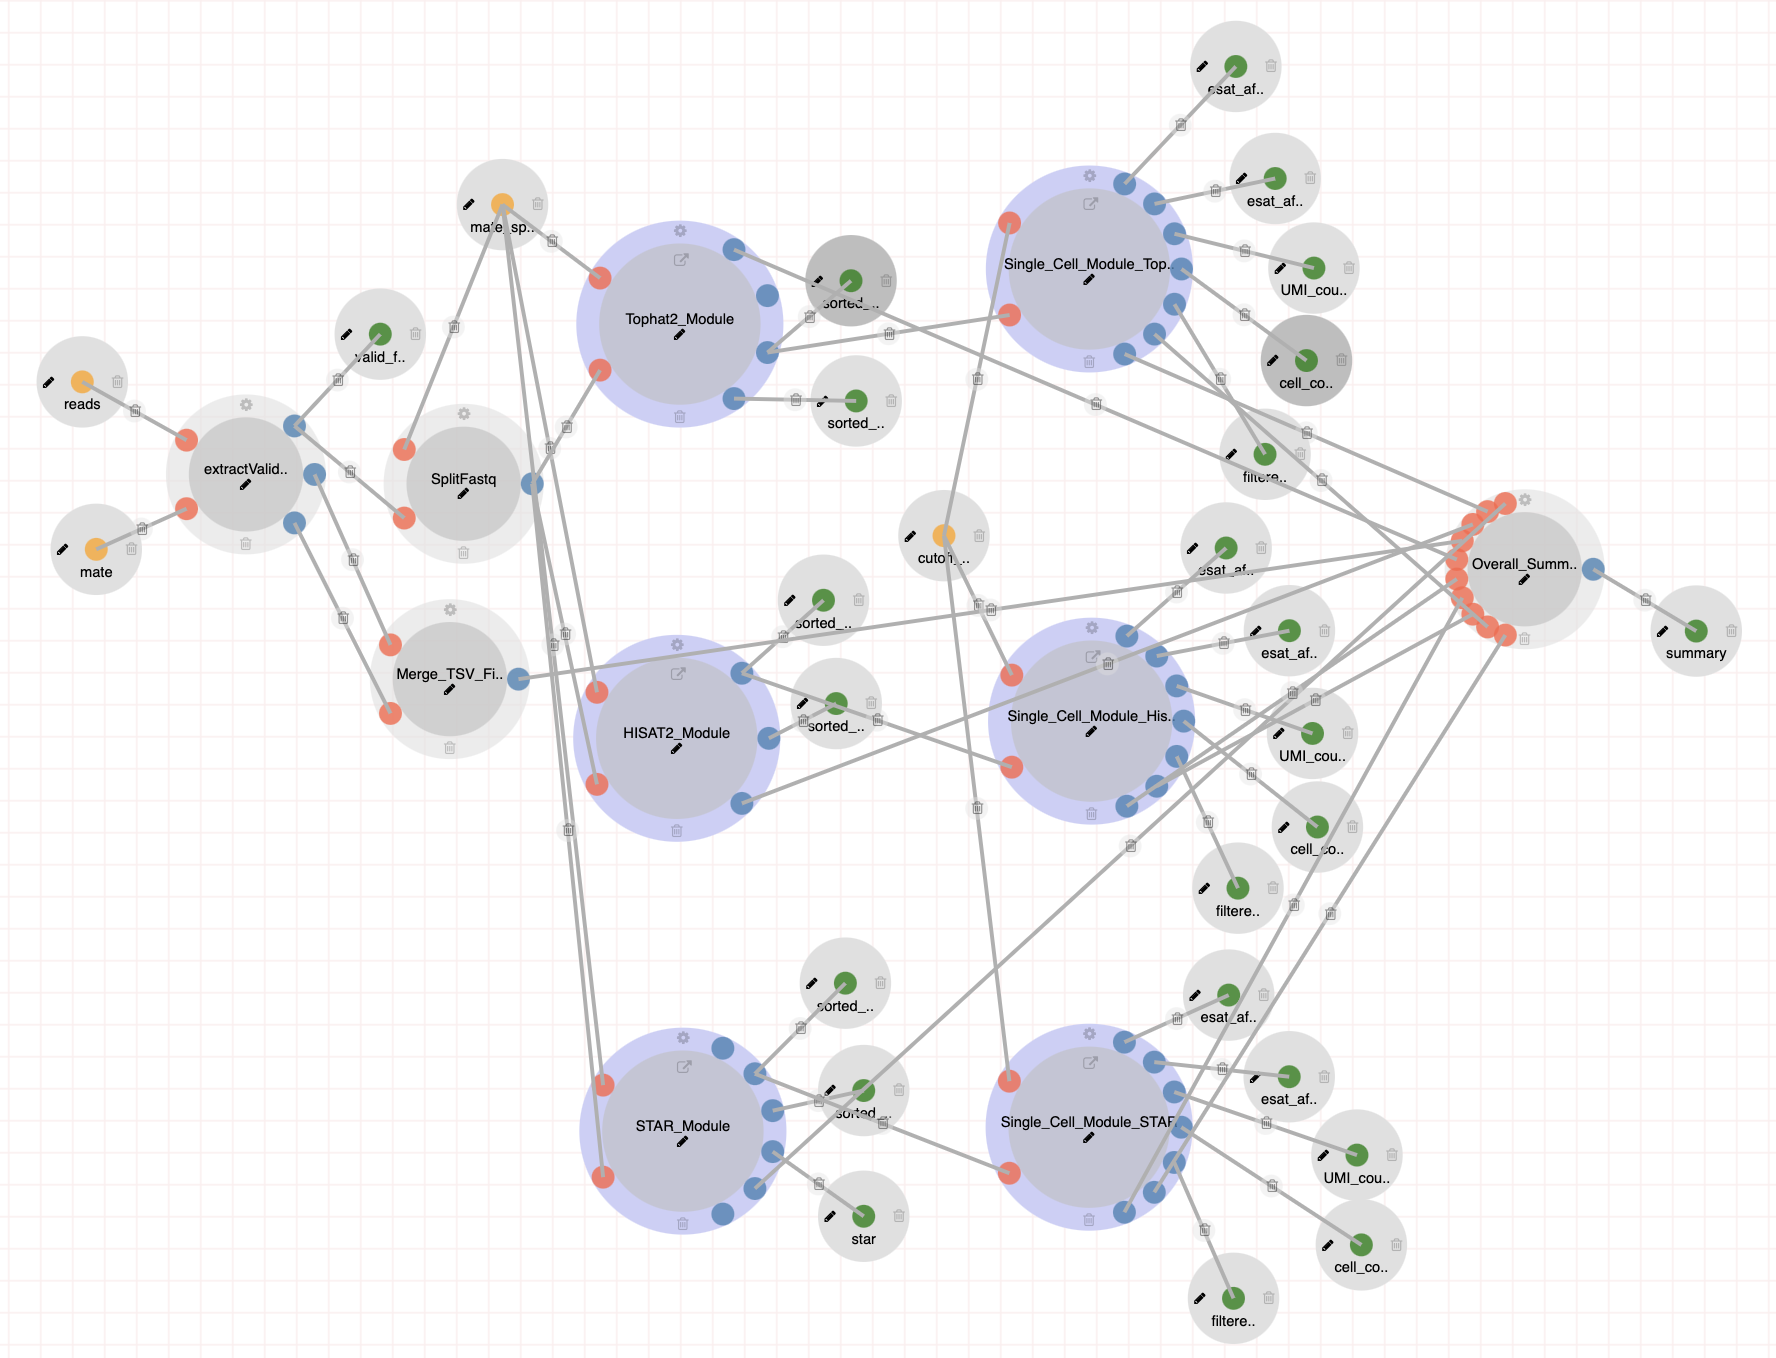
scRNA-Seq (Tasic et. al 2018) Pipeline 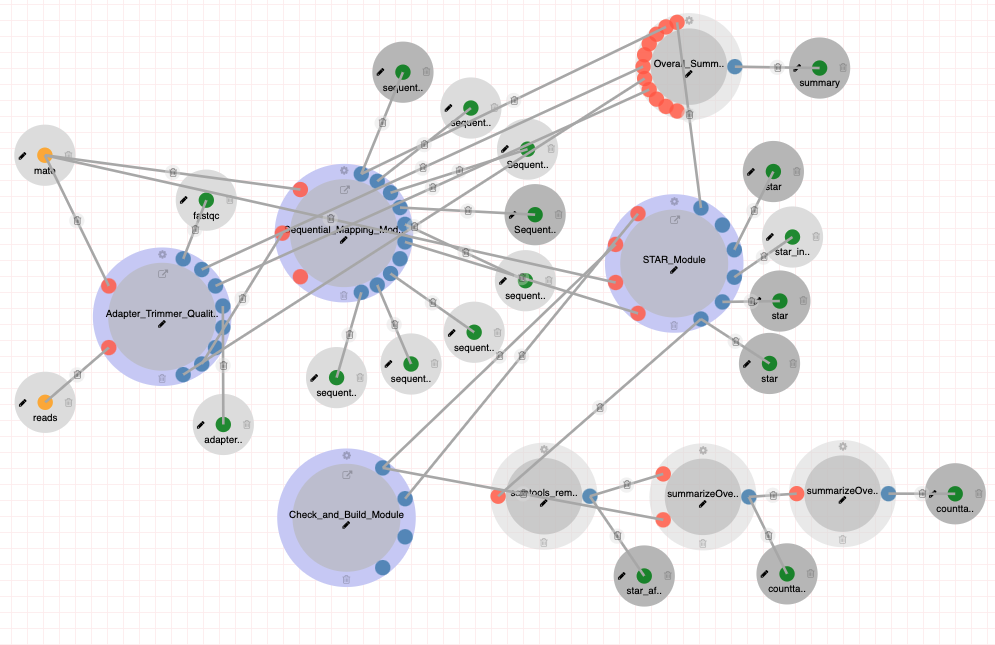
|
The scRNA-Seq (Tasic et. al 2018) pipeline includes Quality Control, rRNA filtering, Genome Alignment using STAR and estimates gene expression levels by GenomeAlignment Package in R. Steps:
Docker: https://hub.docker.com/r/dolphinnext/tasic2018_scrnaseq_pipeline GitHub: https://github.com/dolphinnext/tasic2018_scrnaseq_pipeline |
|
scATAC-Seq (Graybuck et. al 2021) Pipeline 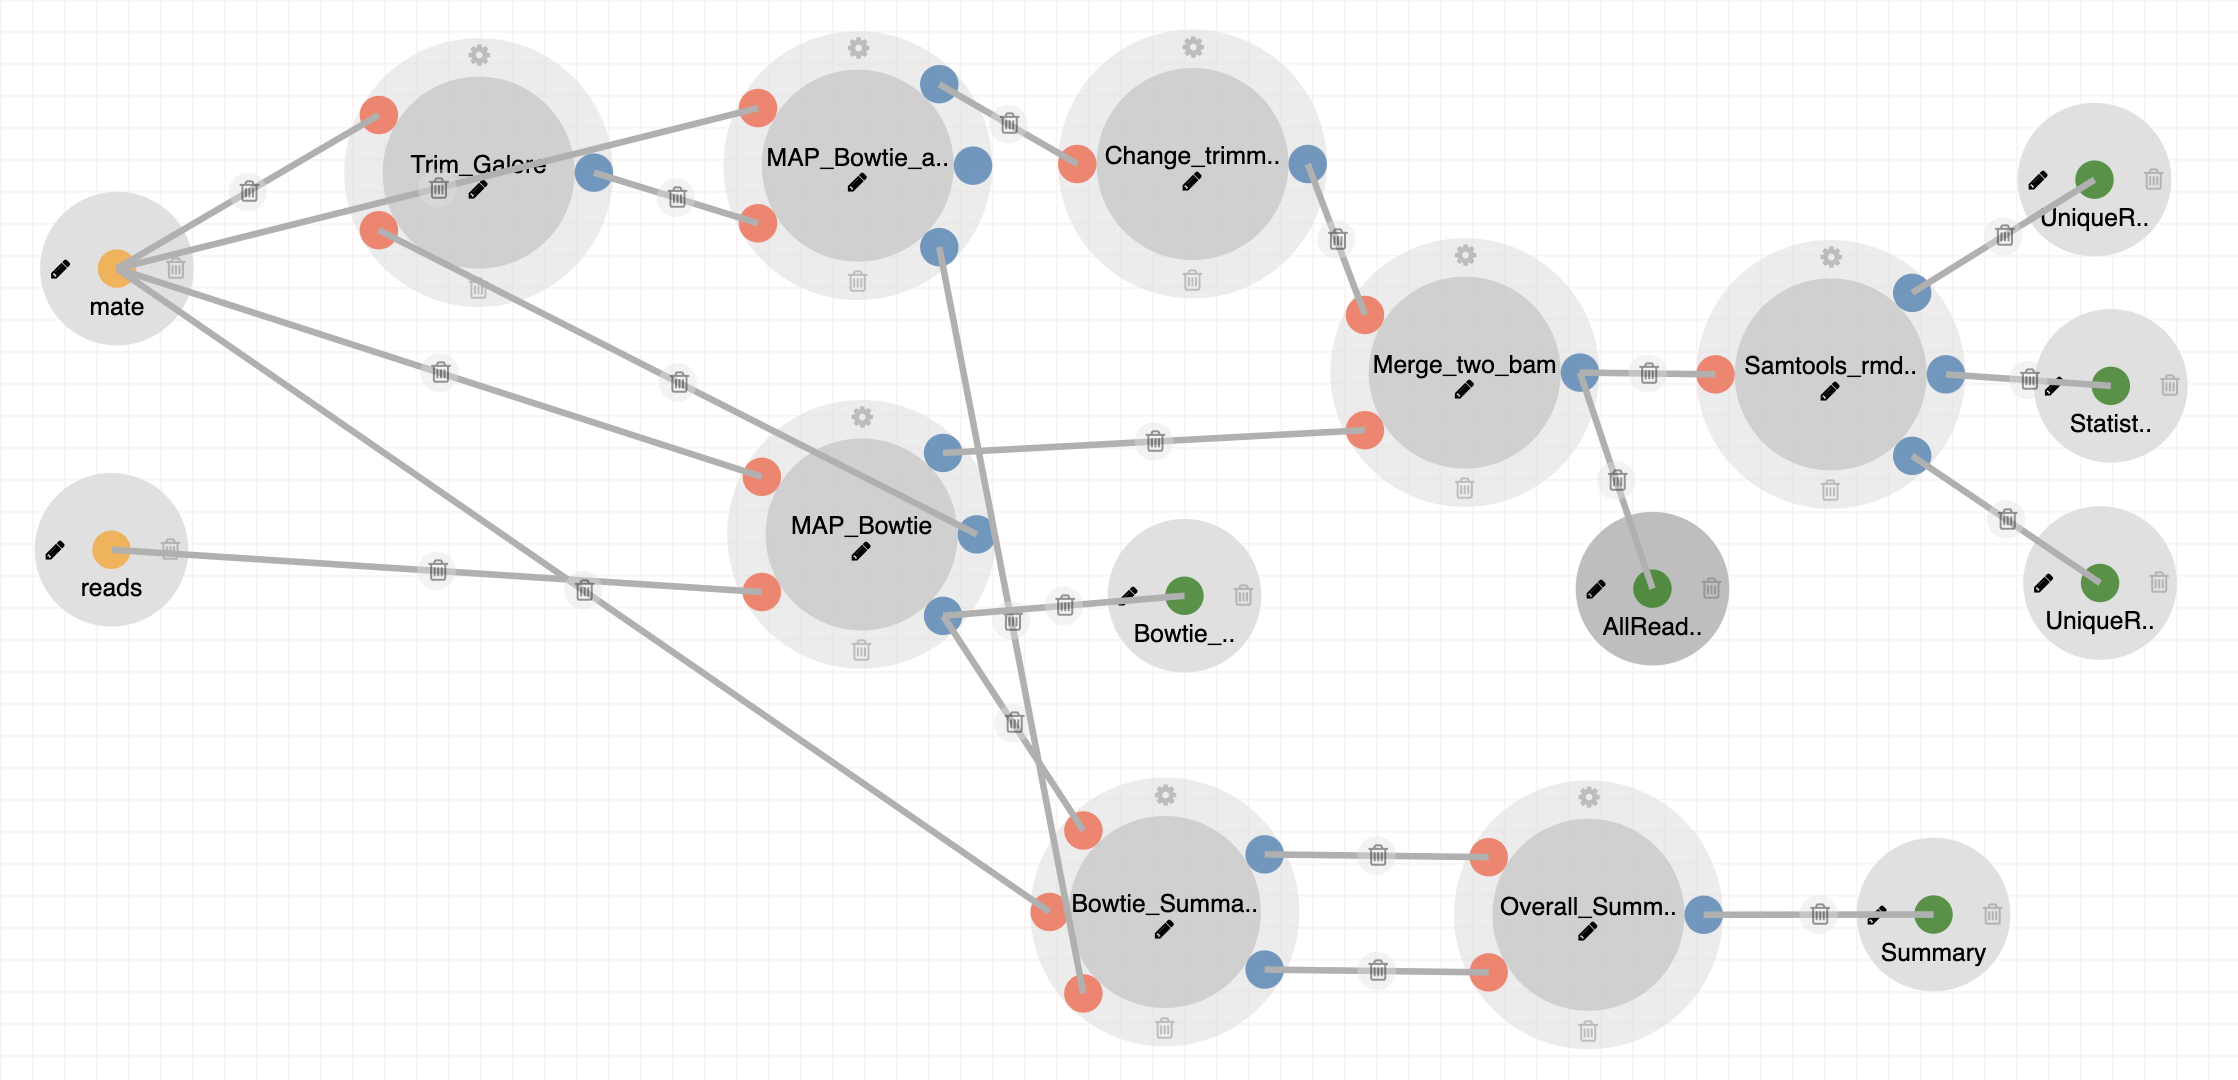
|
The scATAC-Seq (Graybuck et. al 2021) pipeline includes a set of tools necessary for pre-processing ATAC-Seq libraries prepared as in (Graybuck et. al 2021). Steps:
Docker: https://hub.docker.com/r/dolphinnext/graybuck2021_scatacseq_pipeline GitHub: https://github.com/dolphinnext/graybuck2021_scatacseq_pipeline |
|
scATAC-Seq (Mich et. al 2021) Pipeline 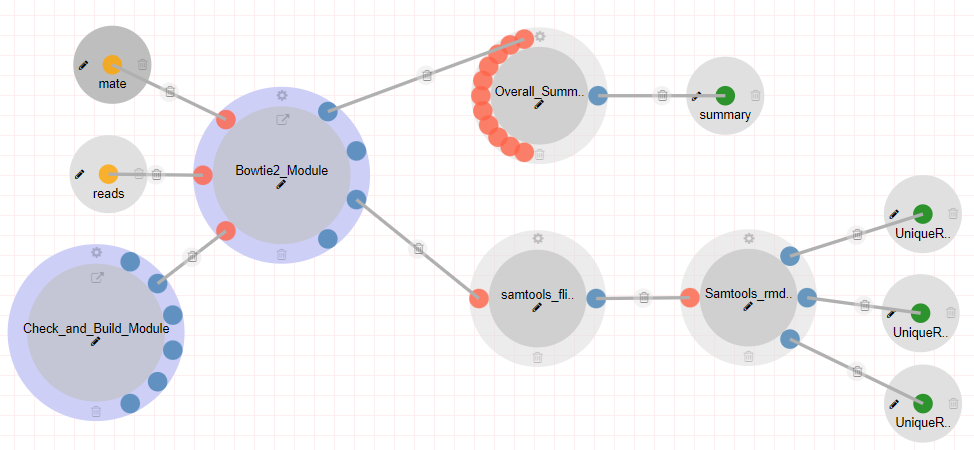
|
The scATAC-Seq (Mich et. al 2021) pipeline includes a set of tools necessary for pre-processing ATAC-Seq libraries prepared as in (Mich et. al 2021). Steps:
Docker: https://hub.docker.com/r/dolphinnext/mich2021_scatacseq_pipeline GitHub: https://github.com/dolphinnext/mich2021_scatacseq_pipeline |
|
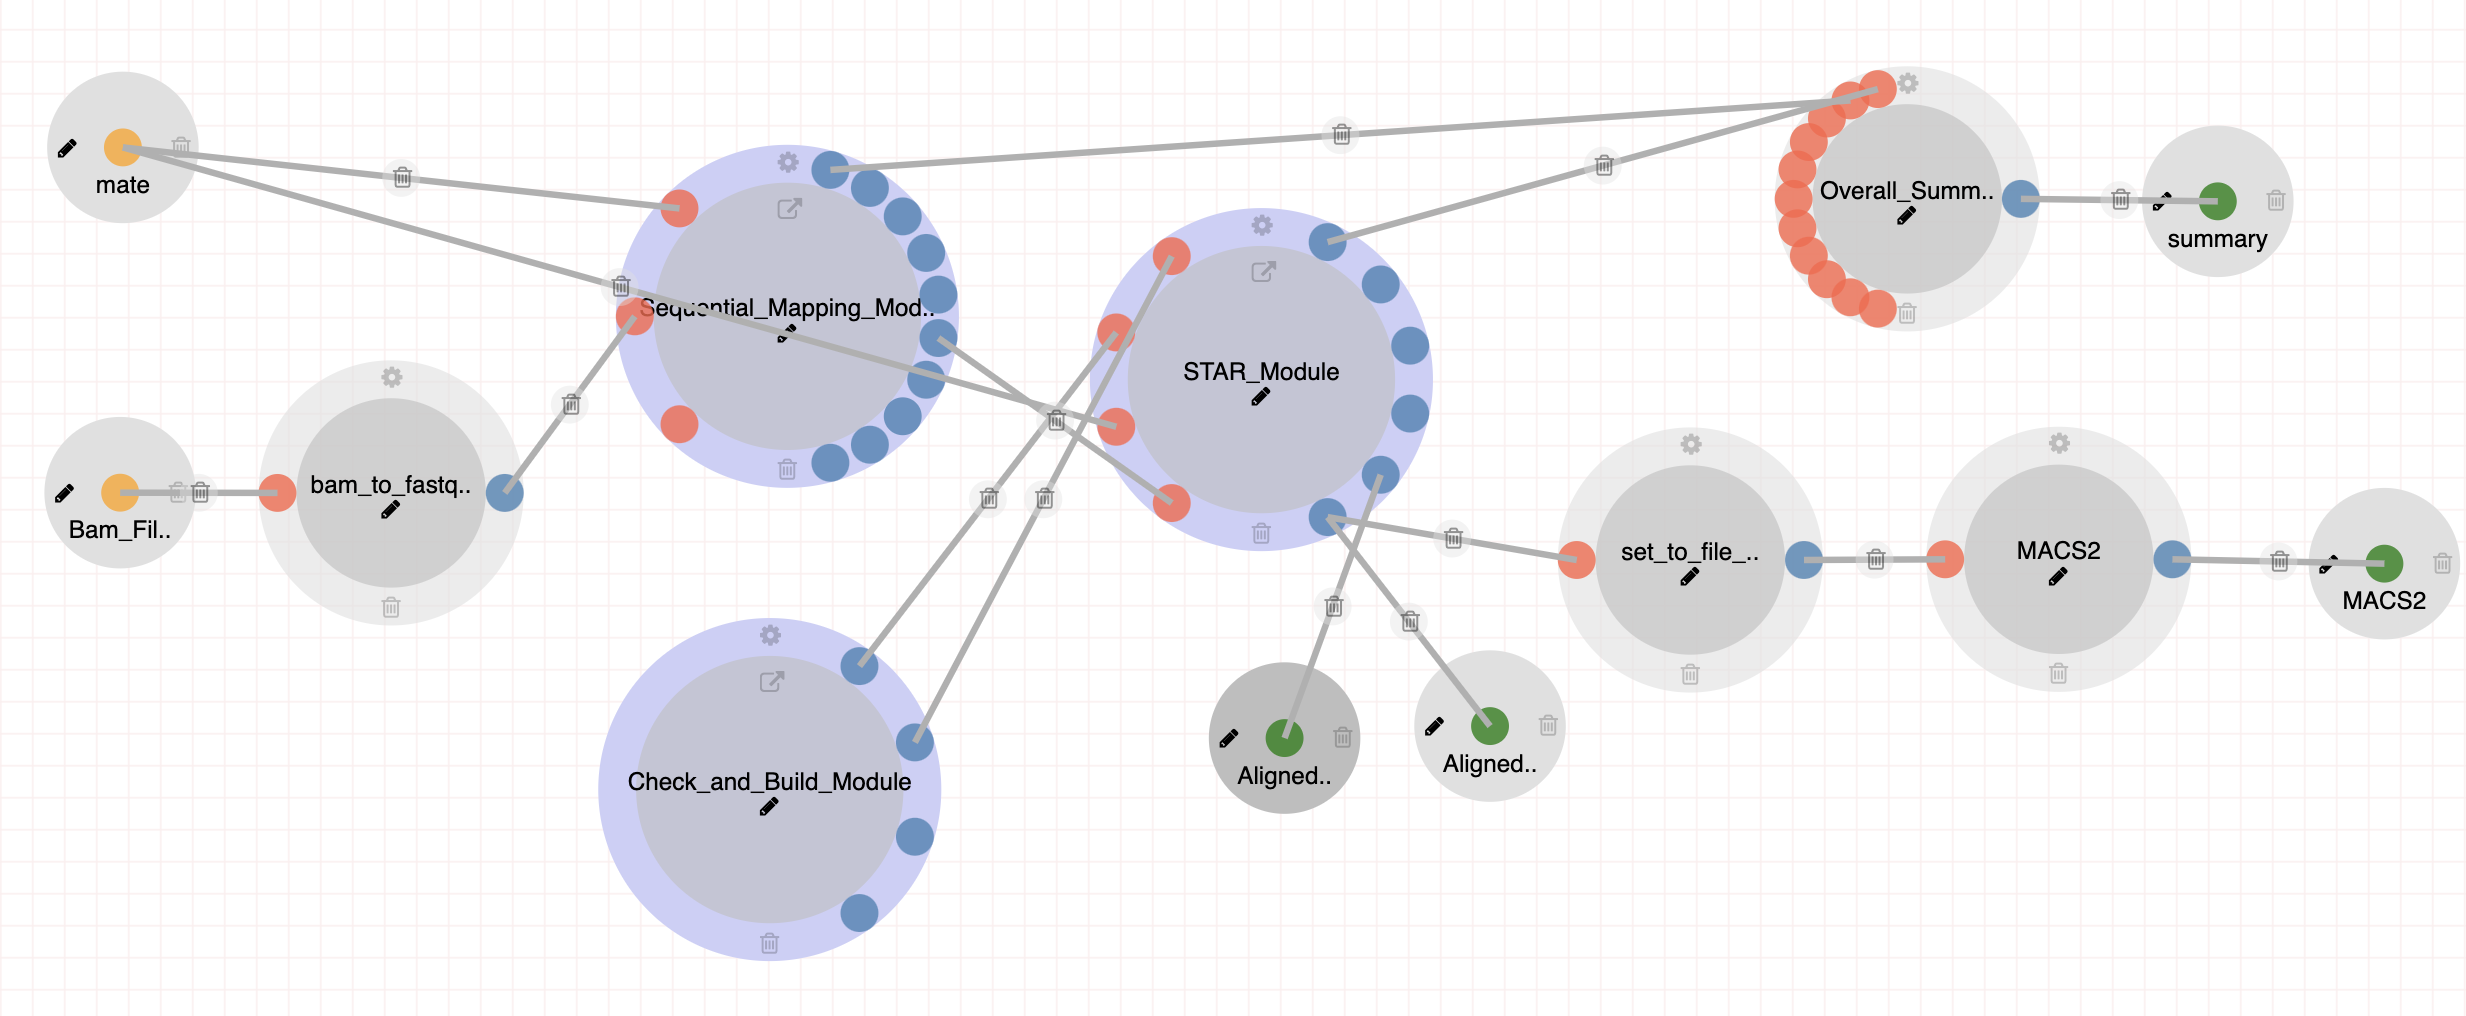
The CAGE-seq pipeline includes rRNA filtering, Genome Alignment using STAR, and peak calling using MACS2. Steps:
Docker: https://hub.docker.com/r/dolphinnext/cageseq_pipeline |
Downstream Analysis Pipelines
DolphinNext can also be used to design downstream analysis pipelines that may incorporate processed sequencing datasets to further investigate cell types of interests and build necessary files for online applications such as Cellxgene and UCSC Track Hub.
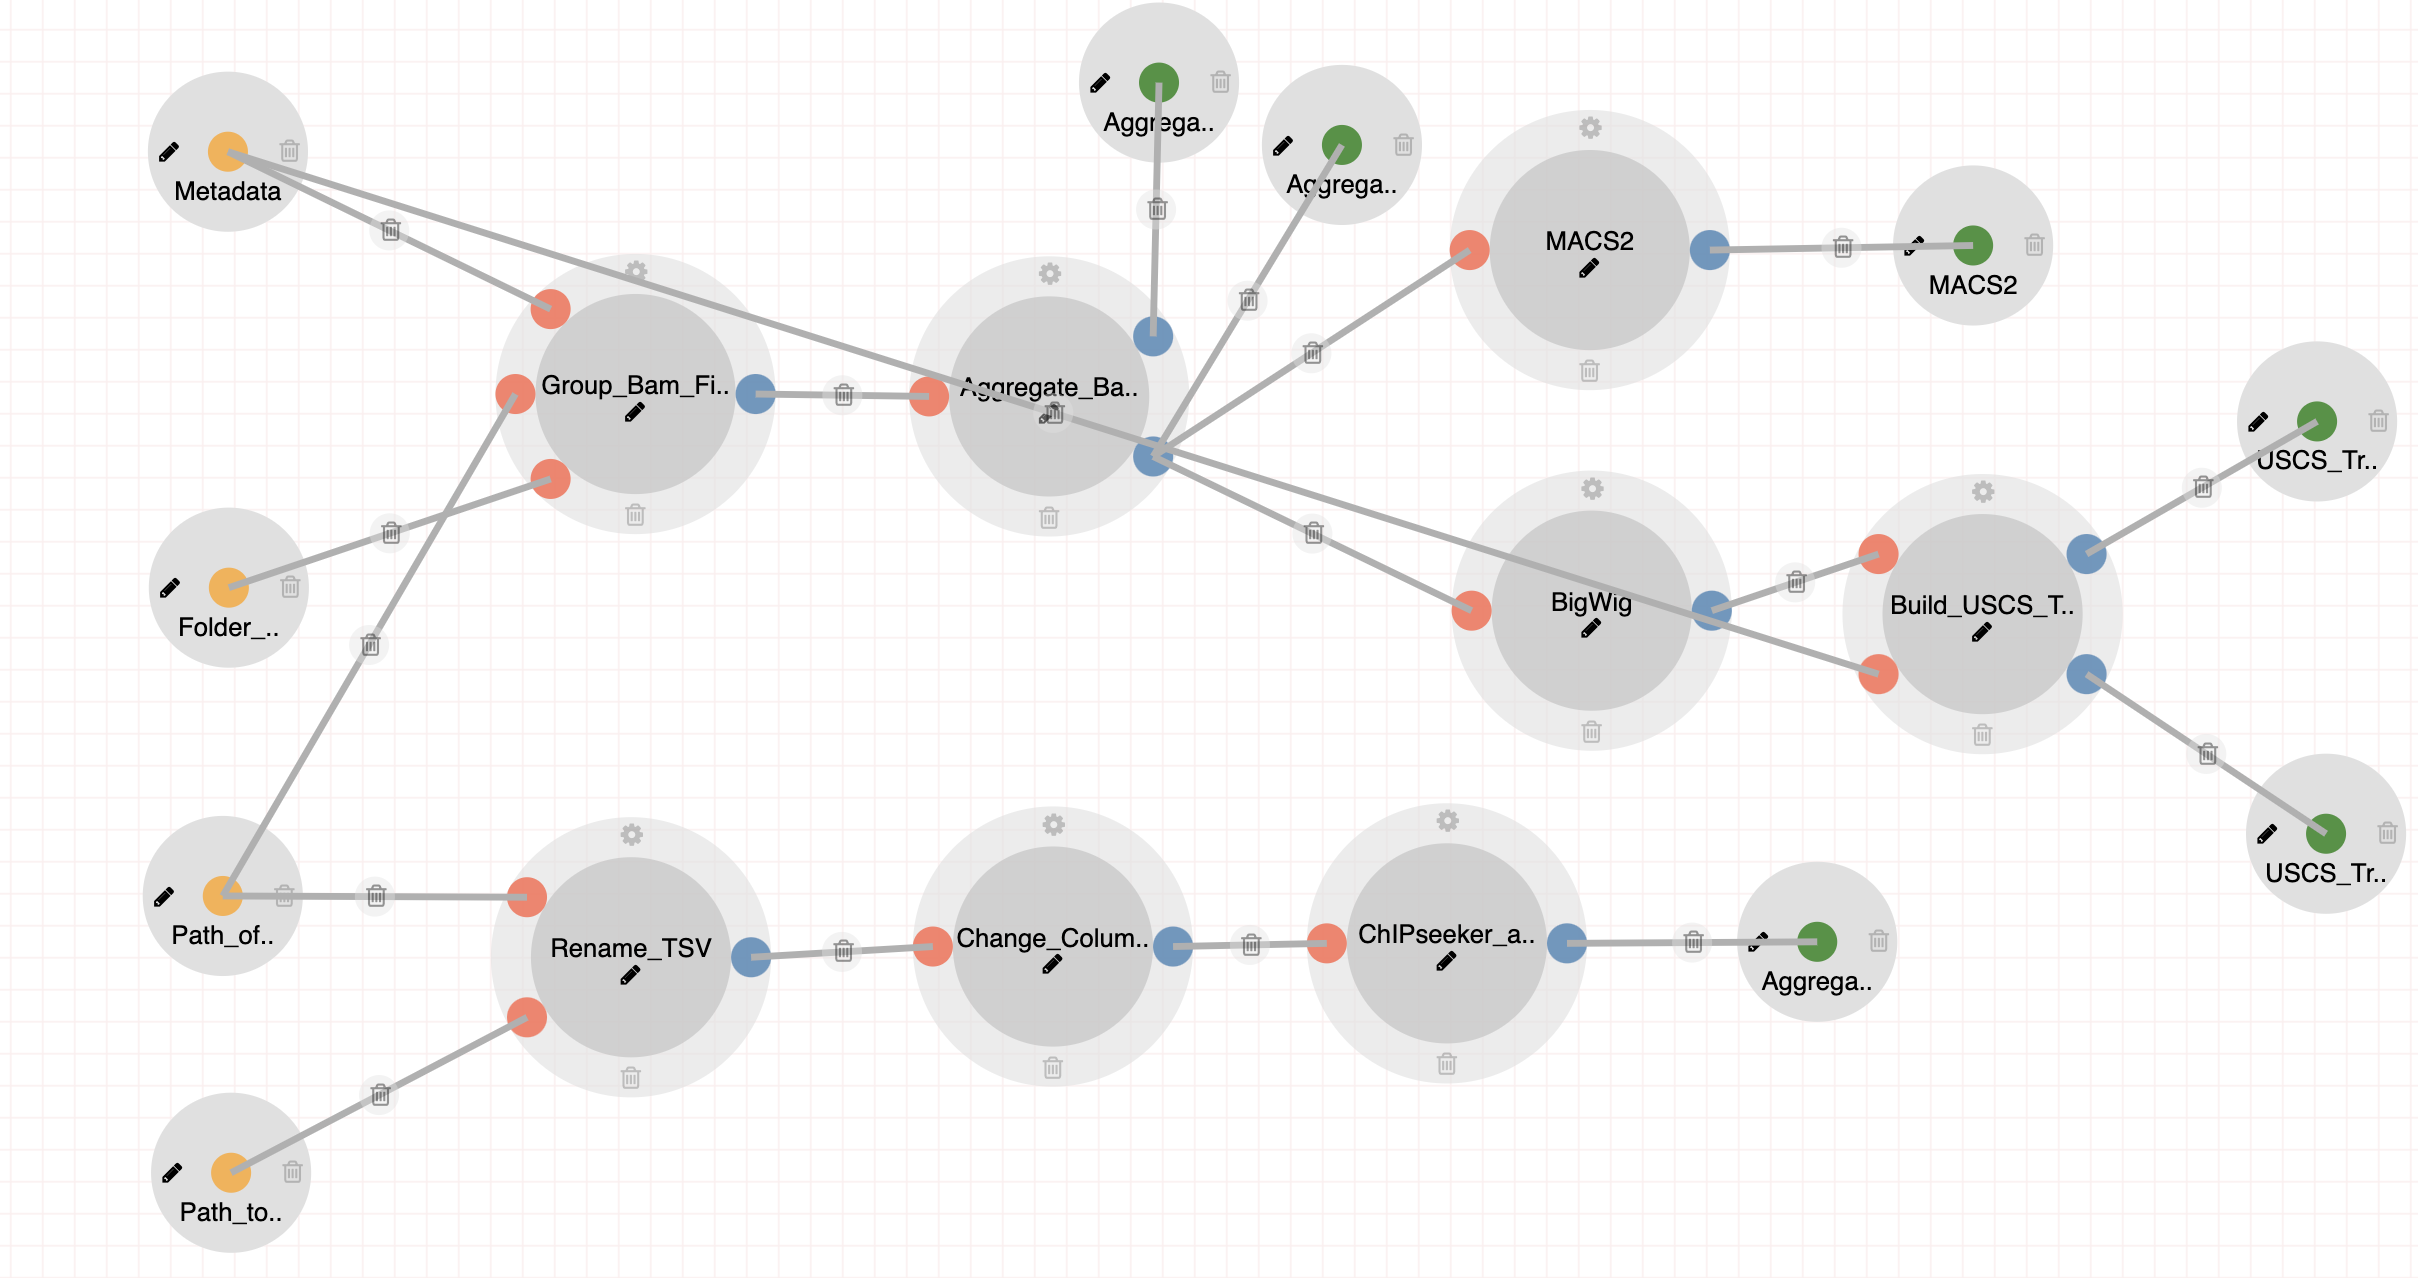
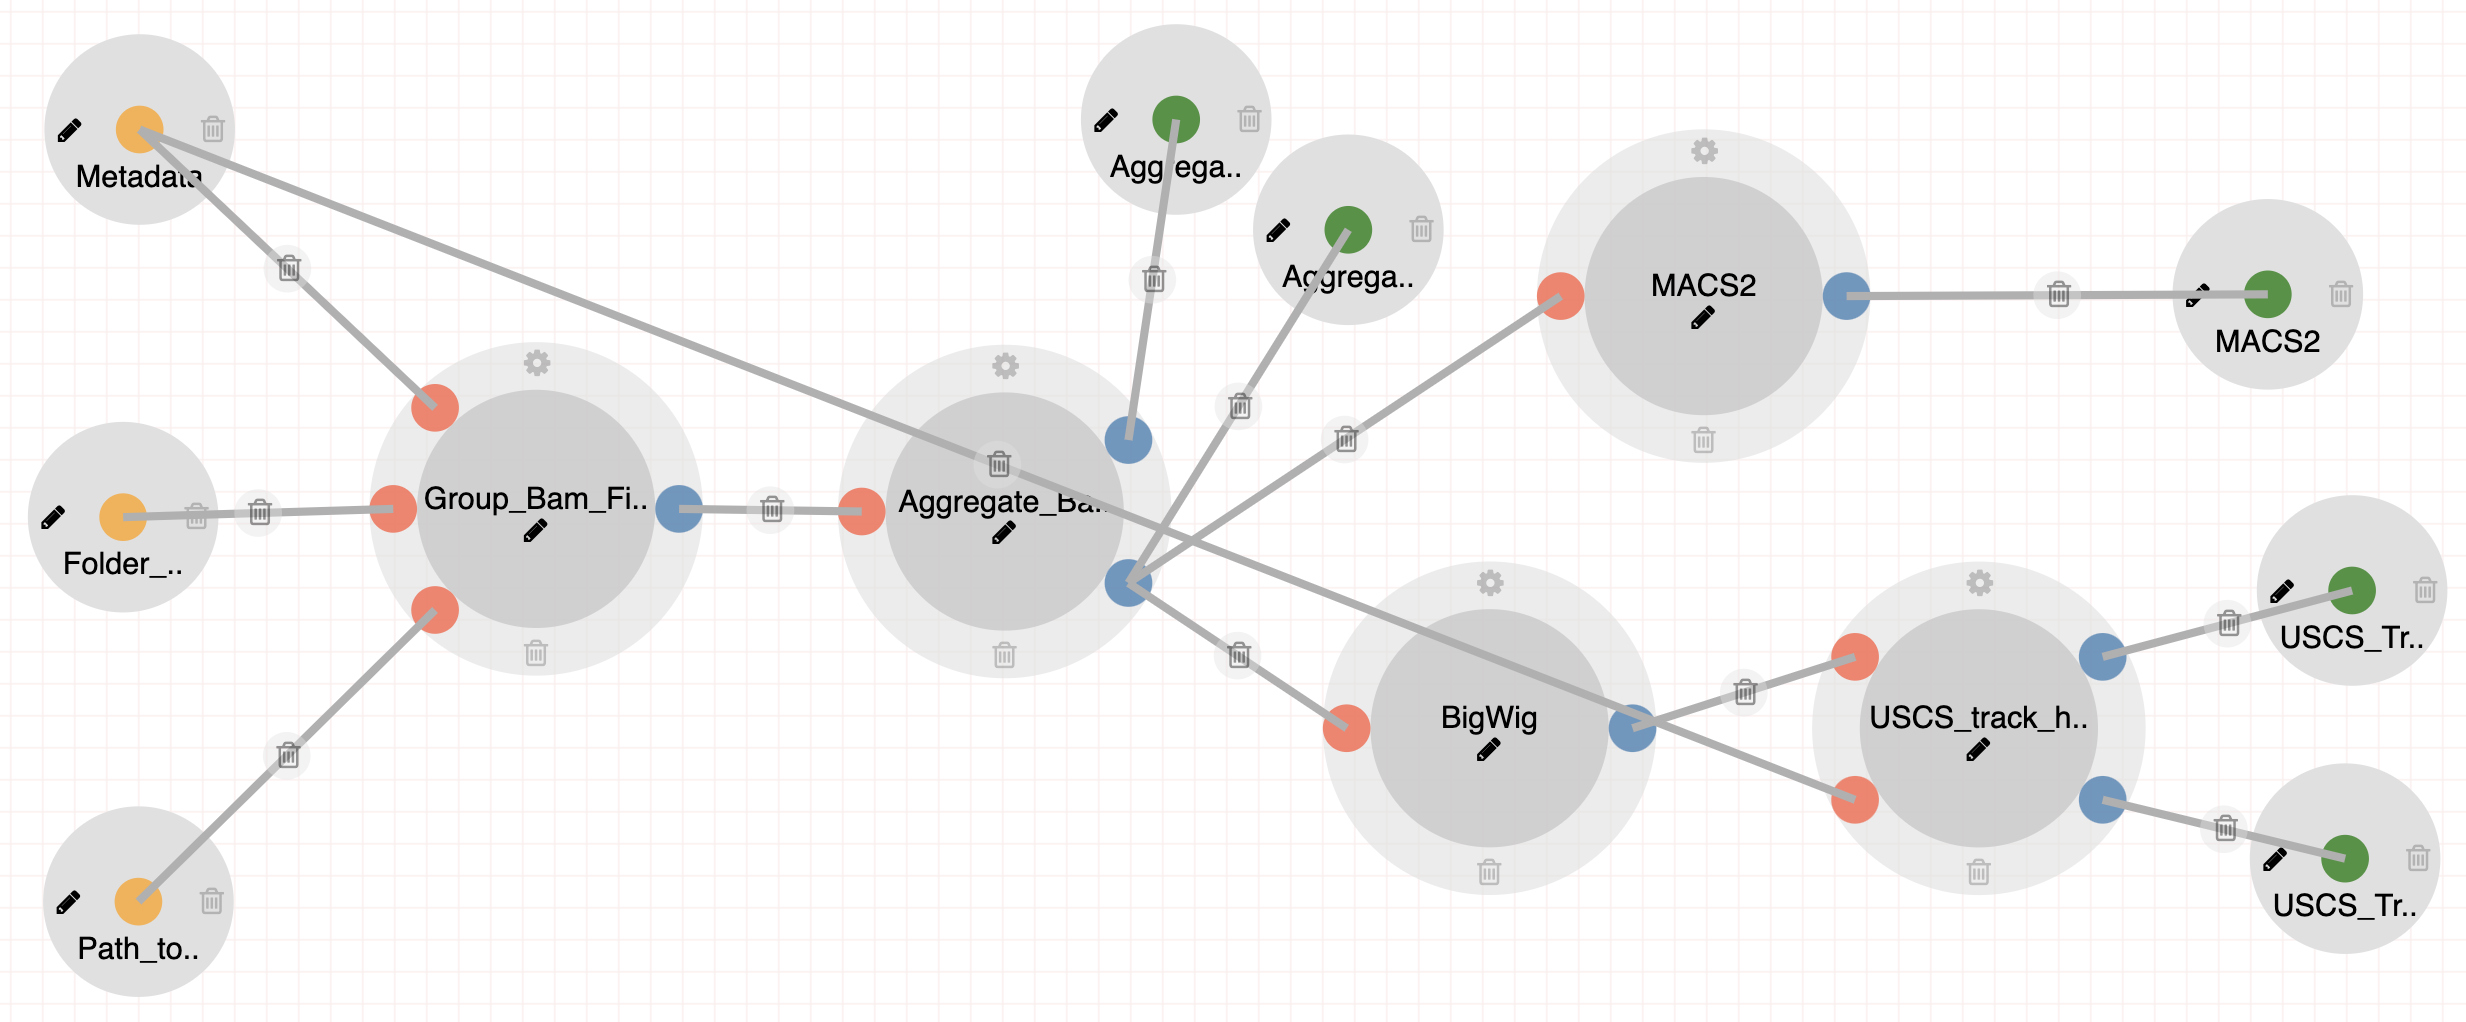
All Aggregate Analysis pipelines incorporate a few number of common processes as well as steps geared towards each individual sequencing technology or dataset.
Steps:
- Aggregating Bam Files with unique mapped reads to Cell Types.
- Peak Calling with MACS2.
- Creating BigWig files for UCSC Genome Browser.
- Creating auxiliary files for building custom UCSC track hubs.
- Single cell RNA downstream analysis using Seurat (only for scRNA-Seq pipeline)
- Making h5ad files for visualization in Cellxgene (only for scRNA-Seq pipeline)
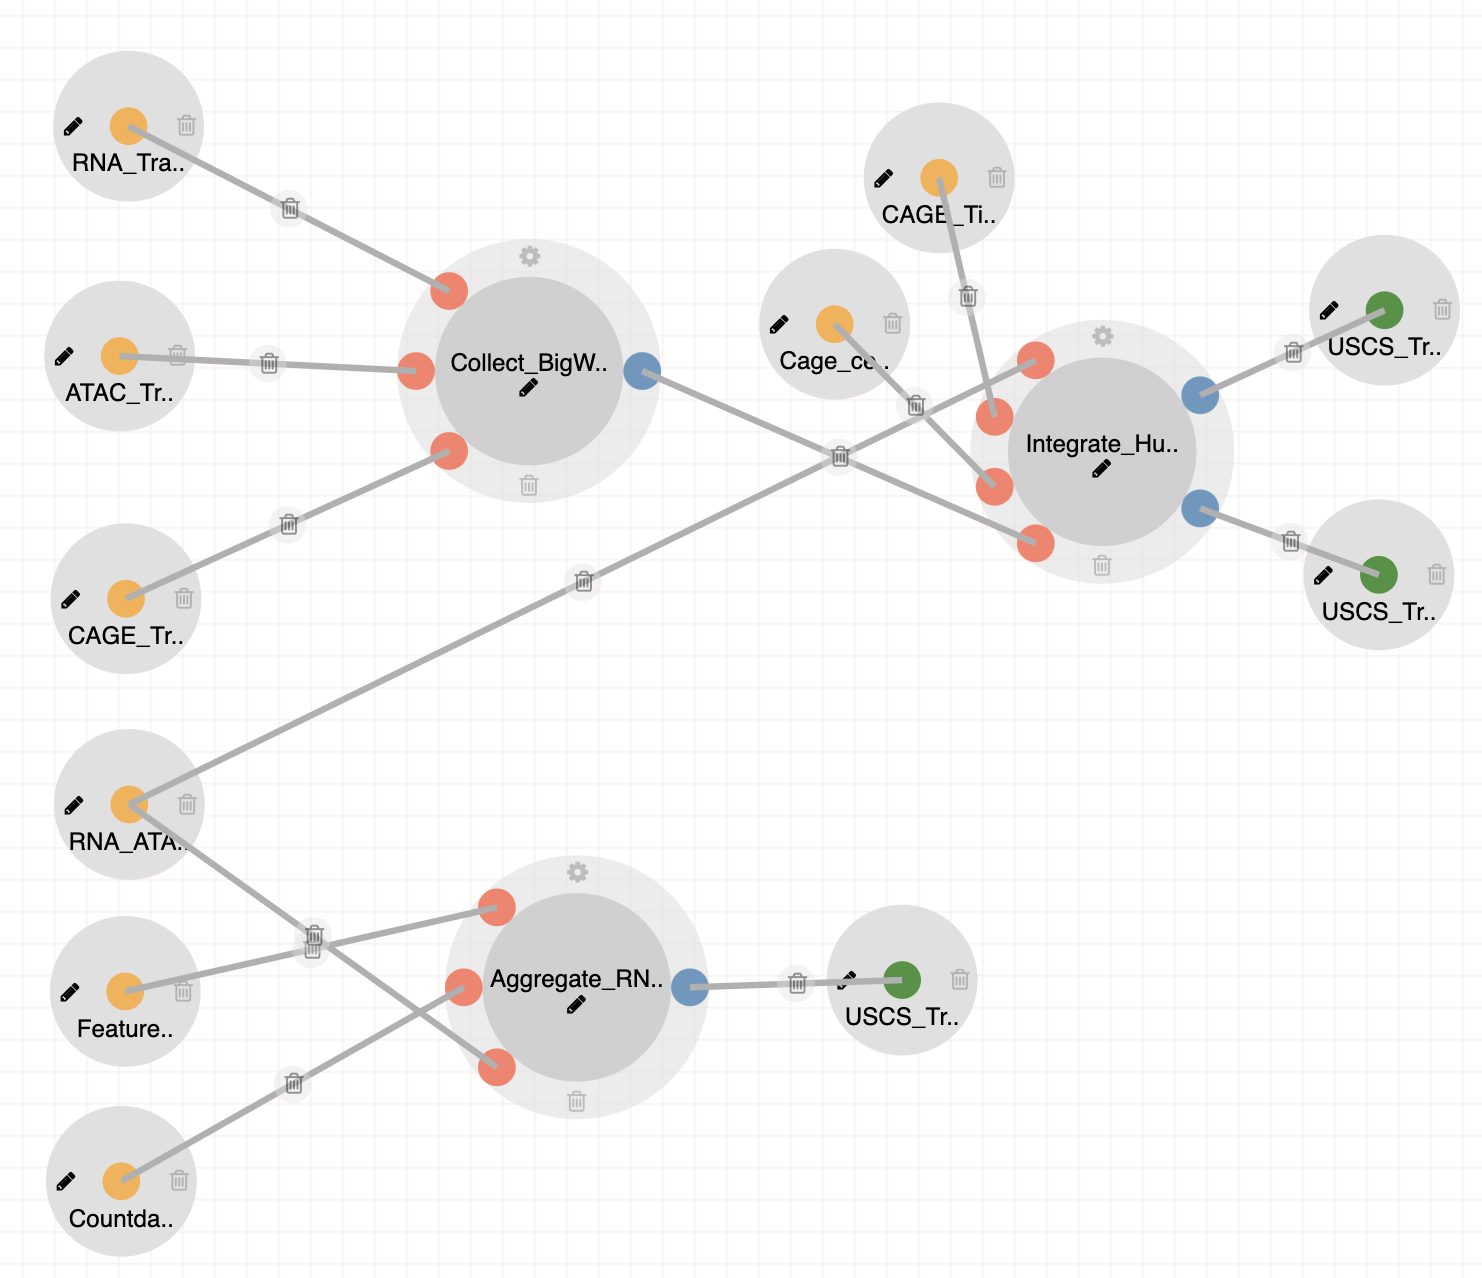
We have designed an additional downstream analysis pipeline (see Integrate-MultiOmics-Tracks) to build a large custom UCSC Track Hub of combined scRNA-Seq, scATAC-Seq and CAGE-Seq analysis. The resulting UCSC track hub can be accessed from here: mouse and human.
|
Aggregate Analysis (Tasic 2018) 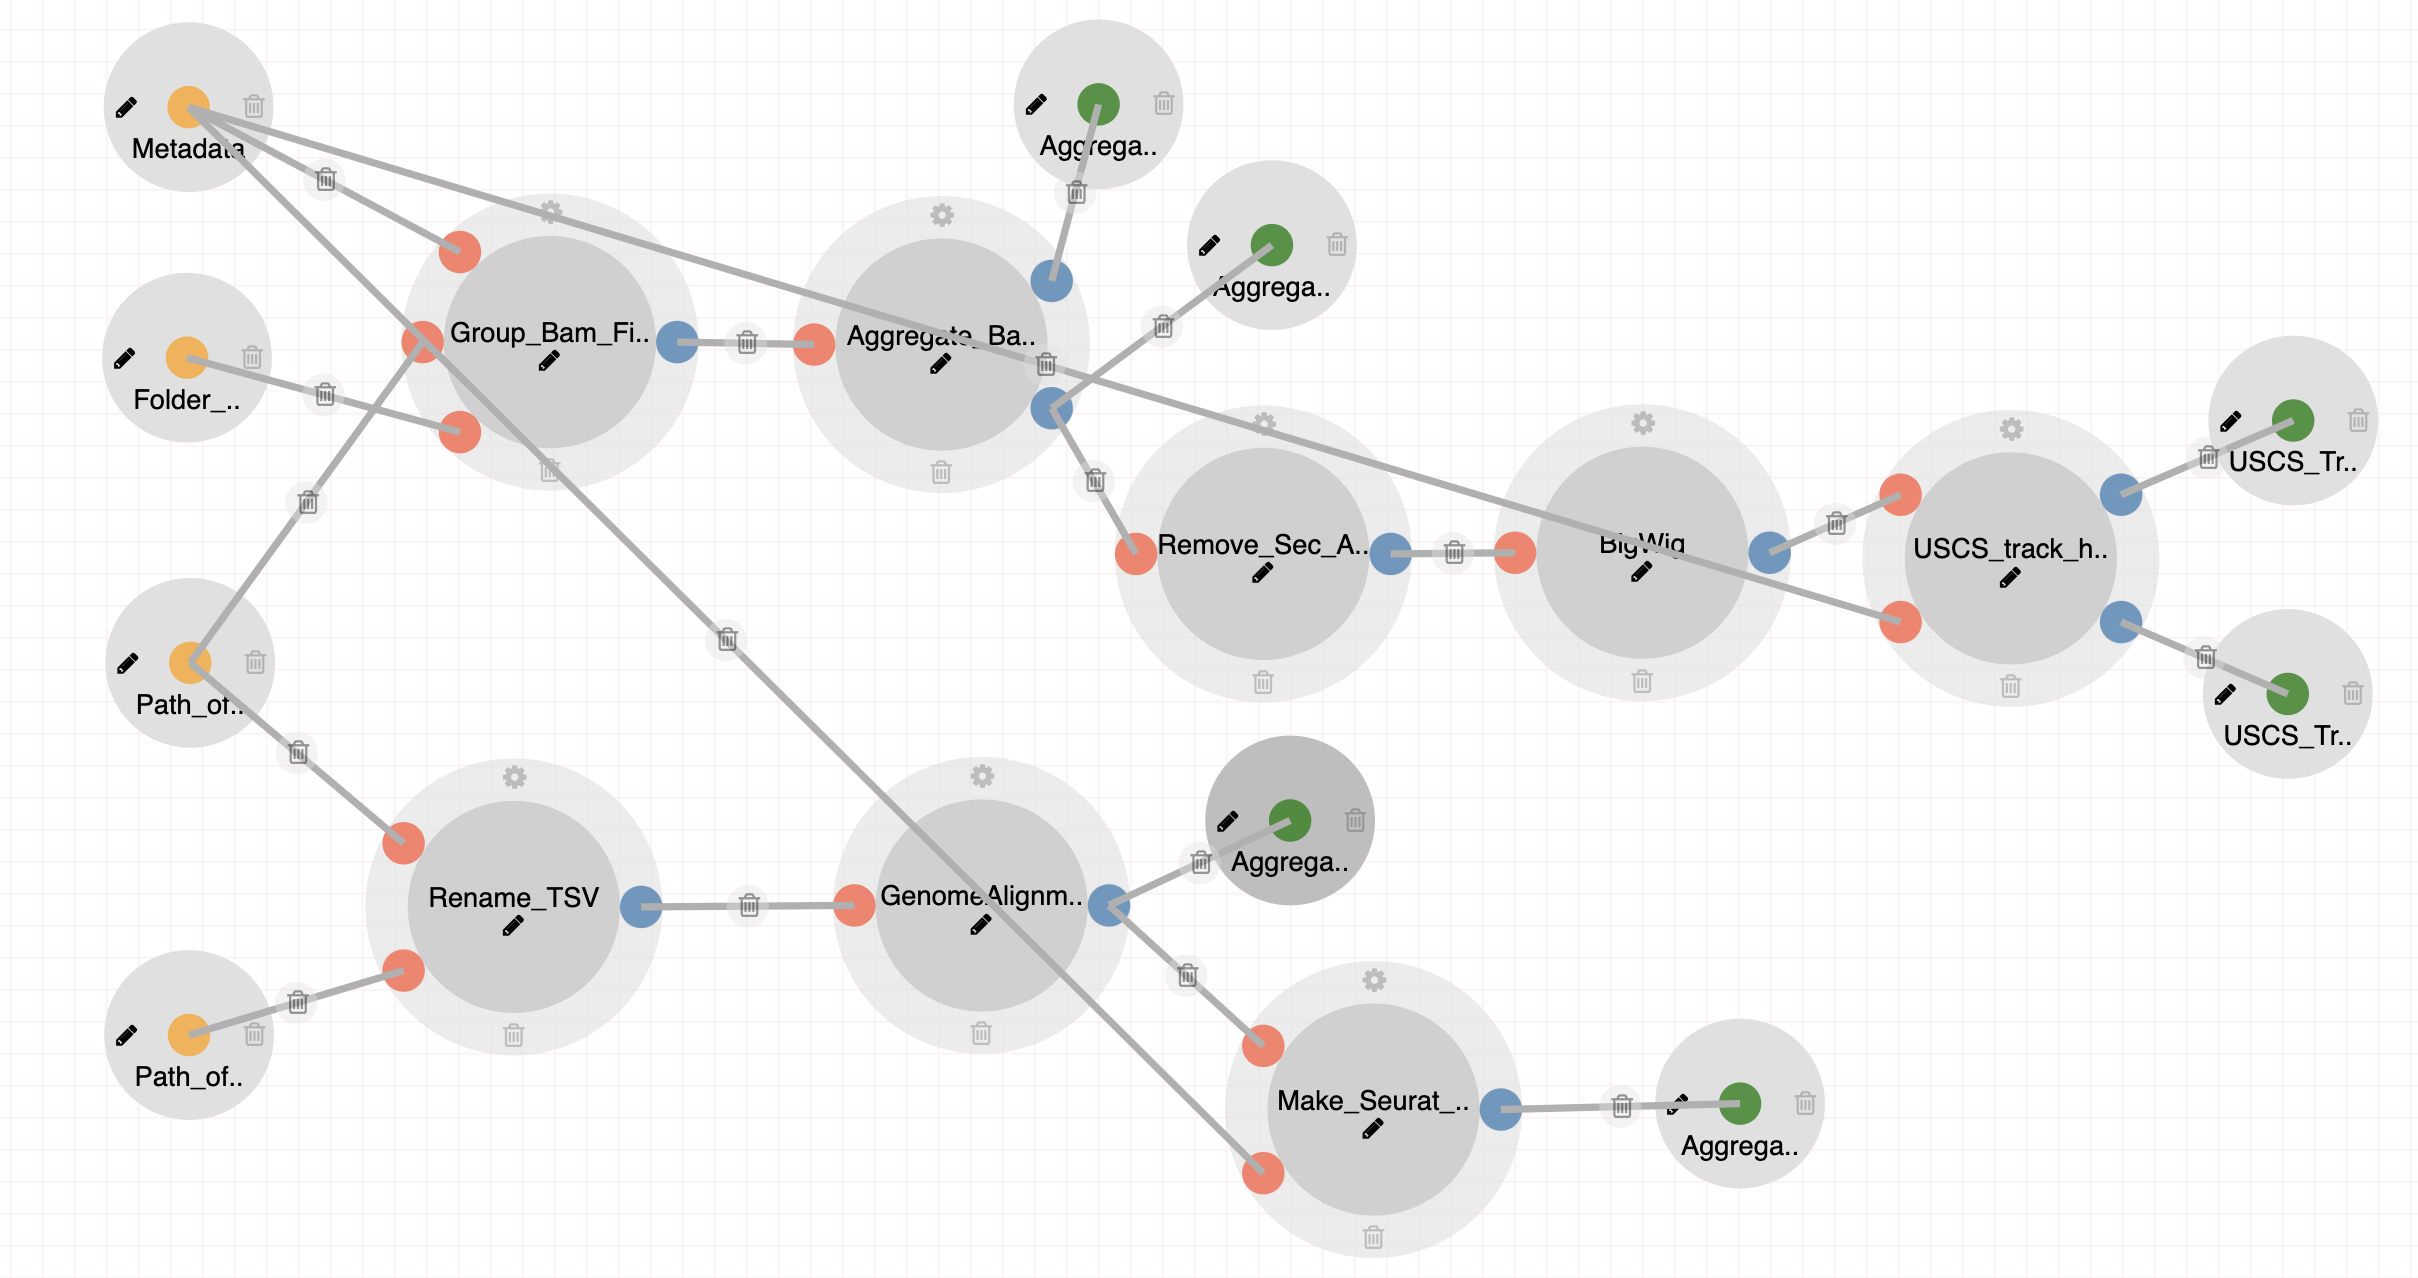
|
|
|
|
The Integrate-MultiOmics-Tracks pipeline generates a custom USCS Track Hub and auxiliary tables for interrogating RNA, ATAC and CAGE seq reads from following studies: Steps:
|
|